Nonfarm Payrolls (NFP): What It Is and Why It Matters
Every first Friday of each month, the US Bureau of Labor Statistics releases its Nonfarm Payroll Report (NFP). Eagerly anticipated by traders, this report captures the total number of jobs created by the private sector, less the agricultural field, during the previous month.
Why it matters
The US monthly jobs report serves as an indicator of economic growth and currency strength. Changes in employment positions are closely monitored by policymakers, being one of the key mandates on the Federal Reserve’s agenda when setting its policies, having a direct impact on currency performance.
Typically, despite the multiple indicators modelling estimates, NFP figures tend to surprise either to the upside or the downside, triggering considerable market volatility. Nevertheless, higher-than-consensus numbers tend to be bullish for the USD.
Why are farming jobs excluded from the NFP report?
Due to the seasonal nature of farming, jobs and wages in this sector can vary considerably by time of year, location, weather conditions, etc. Data collected in one area of the country in the space of one week may differ significantly from data in another area, the national or yearly data. Furthermore, the US Department of Agriculture is tasked with collecting and monitoring farming labour changes.
How to assess market impact
As with many other economic indicators, the discrepancy between the actual NFP data and economists’ estimates or expectations determines the market impact. The Forex market is the most sensitive to the actual employment change by adjusting prices and interest rates.
If the expectation is that the USD will be weaker amid concerns about the stability and overall health of the US economic environment, and implicitly, the non-farm payroll growth will not be as robust as economists estimate, Forex traders might be tempted to sell US dollars for other currencies, pushing the greenback lower.
For example, in July 2024, the official non-farm payroll data showed that the American economy added 114,000 new jobs, significantly lower than the 175,000 estimate, and shy of the 122,000 forecast of ADP, the US largest payroll provider.
The downbeat figures pushed the USD lower against its EUR counterpart, as the EURUSD pair hovered slightly above 1.1097 on the day, as shown in the TibiGlobe chart below.

In contrast, the opposite applies if the actual data is stronger than economists’ consensus. Upbeat data may prompt traders to buy USD on expectations that the economy shows signs of robust growth.
What to expect in August?
When it comes to the NFP, one question hovers in the air: will August figures beat or meet expectations? We will be able to answer this question on Friday, September 6 when the US Bureau of Labor Statistics releases the NFP report.
Meanwhile, let us take a look at economists’ projections, which despite their purely estimative nature, do offer an idea of what to expect.
Trading Economics analysts estimate that the US non-farming job sector will grow by 130,000 by the end of Q3. In the longer term, the Nonfarm Payrolls are expected to trend around 170,000 in 2025, according to Trading Economics econometric models. Only time will tell if these stats will be confirmed by reality.
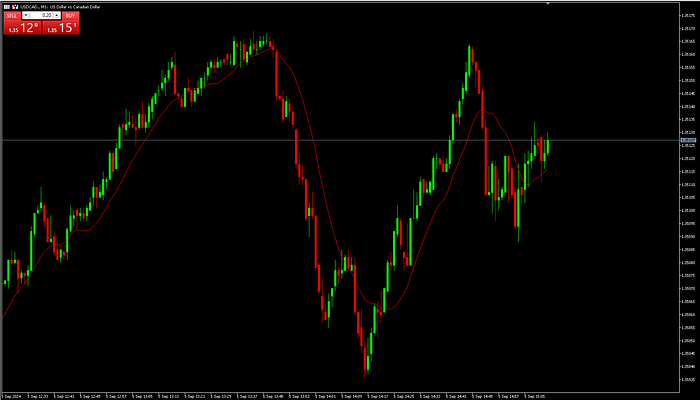
In other news, neighbouring Canada is due to release its employment change data on September 6, bringing a long-term buck contender into the picture — the loonie. Against this backdrop, USDCAD is a pair to watch in the coming days.
Ahead of data, the buck-loonie pair appears to have gained momentum as traders expect a less aggressive rate stance from the Fed in September as they await the US ISM Manufacturing PMI reading due September 3. Let’s take a look at the chart!
At the time of writing, the USDCAD pair hovers in the 1.3512 area, as market sentiment inclines towards a 25-base point rate cut by the Fed in September. At the same time, the continued rise in US Treasury yields provides further support for the US dollar.
Inversely correlated with the US dollar, gold continues its decline in lacklustre performance ahead of crucial economic data. Hovering around $2,500, gold remains in negative territory for the third day consecutively.
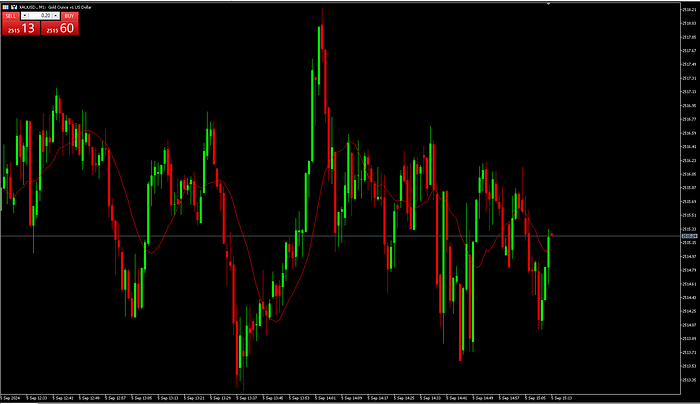
Whether this pattern will be broken after the data releases remains to be seen. Until then, keep an eye on the TibiGlobe platform to make sure you never miss an update, stay focused, study the markets and trade responsibly!
Connect with us on social:
Facebook | X | Theads | Instagram | Telegram | LinkedIn
Risk Warning: Contracts for Difference (CFDs) are complex financial instruments and may not be suitable for all investors. Trading CFDs involves substantial risks of losing your invested capital. It’s important to note that CFDs are a leveraged product, which means they can magnify both potential gains and losses. It’s crucial to understand that CFD traders do not possess ownership or rights to the underlying assets.